
After LLMs, the arguments the latest models lean on are too weak compared to a 2021 model.
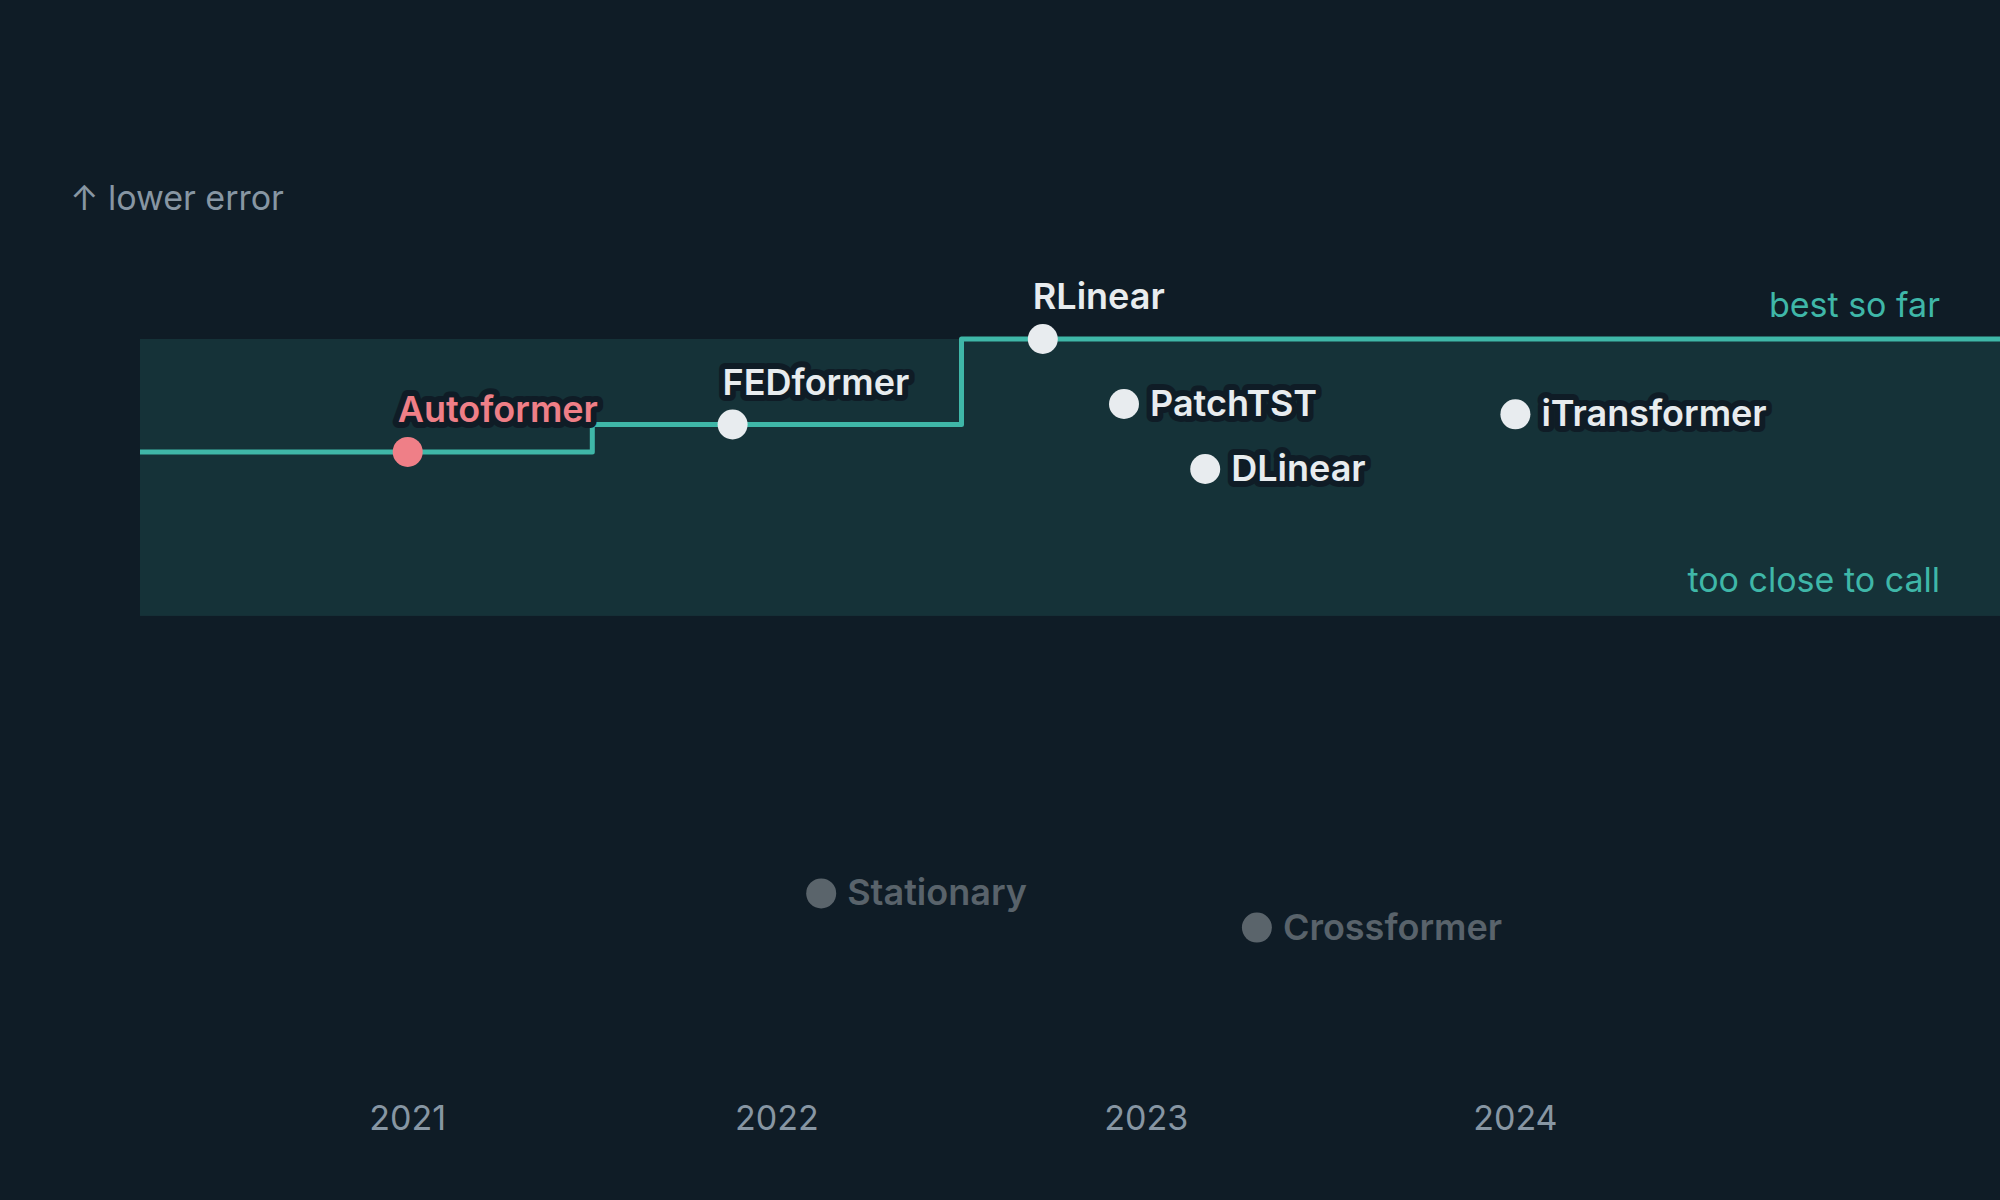
At the longest horizon of the ETTh1 dataset, I find Autoformer, a model from 2021, statistically indistinguishable from the new model each of three flagship papers proposes: PatchTST and TimesNet from 2023, and iTransformer from 2024. Three years of new architectures separate them, and the test set behind that entry in the table is too coarse to put them in order.
The same coarseness runs through much of the benchmark, and it comes from how the test set is built, before any model is trained.
A race decided at the third decimal
Forecasting papers report results in a league table, with a row per model, a column per dataset and horizon, and one mean squared error in each entry, and a paper wins by posting the lowest number in its column, often by a hundredth or less. On ETTh1 at a 720-step horizon, one 2024 paper reports 0.433 against a rival's 0.446 and claims the win by 0.013.
A race result works the same way, and it counts only if the clock reads finer than the gap between the runners. A clock that reads to the tenth of a second leaves a race won by a hundredth undecided. So I measured how fine a clock each entry in the table is.
2,161 forecasts but only 4 independent ones
The benchmark scores a model by sliding a forecast window across the test period one step at a time, and on ETTh1 at a horizon of
720 that gives 2,161 scored forecasts, but each window shares 719 of its 720 hours with the next, so neighbouring scores are
close copies of one another. Windows with separate targets come round once every 720 hours, and the test period holds four of
them. The standard significance test counts all 2,161 as independent, and so it treats the clock as far more precise than it is.
How I fixed it (kind of)
I trained twelve linear models across the benchmark and took each pair separated by 0.01 to 0.02 MSE, the size papers publish as
a win. Under the standard test 99% of those differences come out significant, and once I correct for the overlap, 41% do. Holding
the published tables to the same standard, I find that 42 of the 66 margins PatchTST, TimesNet and iTransformer report over
DLinear in their own papers sit inside the noise of the entry that holds them.
Why does the choice of dataset matter?
Those 42 cluster by dataset. On electricity and traffic, 71% of the published margins clear the noise, and on the ETT datasets,
19% do. Two properties of the dataset set the split, the number of independent windows and how much the error varies from one
window to the next, so a reader can work out before training whether a dataset resolves a 0.01 win.
One division
Test length divided by forecast horizon gives the number of independent windows, and any paper on the benchmark can compute it from its data loader. A reader who sees that count beside a comparison can judge how far to trust a margin in the third decimal.
2021 models being just as good? Just like GARCH and ARMA are still the best finance models.
The paper, Rethinking Long-Horizon Forecasting Leaderboards, is a poster at the Foundation Models for Temporal Systems workshop
at NeurIPS 2026.